Real-Time Emission Data: Benefits for Auto Businesses

Real-Time Emission Data: Benefits for Auto Businesses
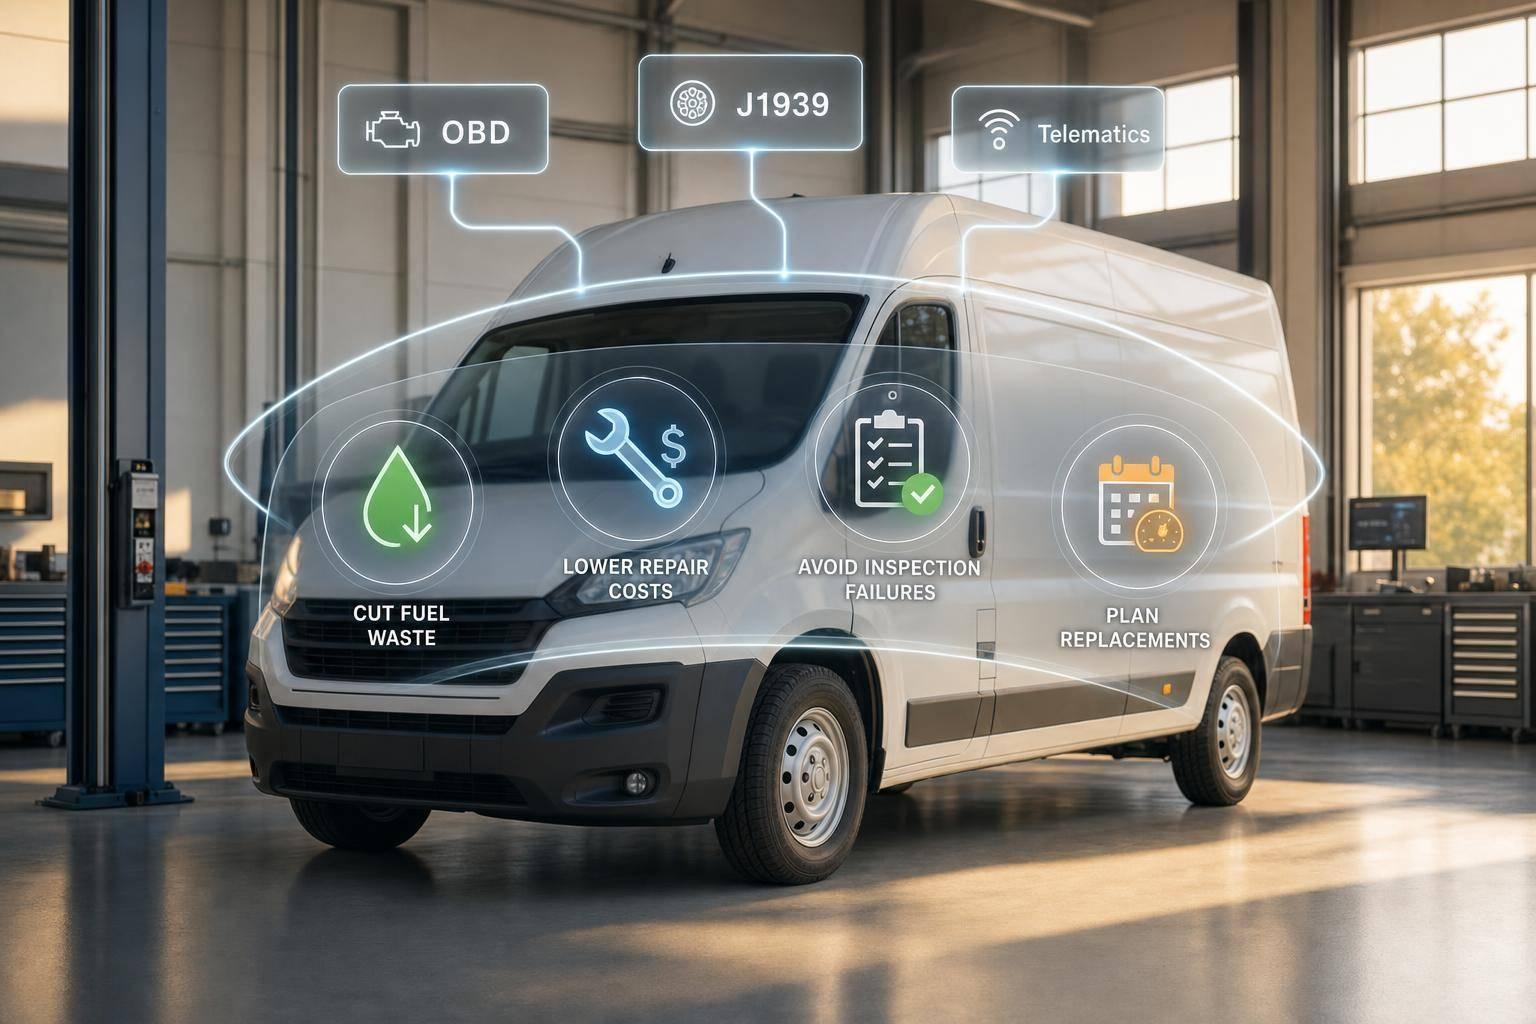
If I had to boil it down to one point, it’s this: real-time emission data helps auto businesses cut fuel waste, lower repair costs, avoid failed inspections, and plan vehicle replacement with less guesswork.
Instead of waiting for a test result, I can use live data from OBD-II, J1939, telematics, VIN records, and fault codes to spot trouble early. That matters because even small issues - like extra idling, a DPF starting to clog, or an emissions fault that blocks inspection readiness - can turn into higher fuel bills, shop delays, and route problems.
Here’s the short version:
- Compliance: I can track readiness monitors, MIL status, DTCs, NOx, CO₂, PM, and fuel use before an inspection date.
- Cost control: Fleets using telematics-based idle alerts saw 15.9% less idling, 22.6% fewer harsh driving events, and about 12% fuel savings.
- Maintenance timing: Live alerts help service teams fix faults before they become breakdowns, derates, or tows.
- Planning: I can sort vehicles into compliant, borderline, and high-risk groups to decide whether to repair, reroute, retrofit, or replace.
- Data flow: The data only helps if it moves from the vehicle into alerts, service systems, and audit records in near real time.
One useful stat stands out: connected vehicles can produce 25 to 67 billion diagnostic data points per day. That tells me the job is not just reading emissions. It’s turning raw signals into clear next steps for compliance, service, finance, and fleet teams.
In plain terms, this article shows how auto businesses can use real-time emission data to lower fuel spend, reduce downtime, support inspections, and make better repair and replacement calls.
Real-Time Emission Data: Key Stats & Benefits for Auto Businesses
Manage Emissions & Fleet Fuel Efficiency With MyGeotab
sbb-itb-9525efd
Regulatory Pressure and Compliance Workflows
U.S. emissions compliance changes across federal, state, and regional rules. For fleets that cross state lines, that’s where things get messy fast. State Inspection and Maintenance (I/M) programs don’t follow one shared playbook either. They differ by scope, test procedure, model year, and pollutant checked. State programs also vary by pollutants tested, model years covered, and test method. For multi-state fleets, the rule that applies can change based on both the vehicle’s registration state and where it operates.
The pressure is building. EPA’s 2024 light- and medium-duty vehicle rule tightens GHG and pollutant limits for model years 2027–2032, and it builds directly on the 2023–2026 standards.[5] EPA also finalized the Phase 3 Heavy-Duty GHG Standards in 2024. Those rules set fleet-average CO₂ targets for Class 2b–8 trucks starting with model year 2027, with tougher performance demands each year through 2032.[2] That doesn’t just shape future planning. It affects compliance, maintenance, and buying decisions right now.
How Emission Data Supports Ongoing Compliance
Real-time data helps fleets catch inspection failures before a vehicle even gets to the test lane. OBD-based I/M testing for model year 1996 and newer vehicles became part of federal I/M regulations in 2001, and it checks readiness monitor status, diagnostic trouble codes, and MIL status to decide pass or fail outcomes.[3][4] If faults stay unresolved or readiness monitors are incomplete, the vehicle fails.
That’s why live monitoring matters. Service teams can spot those issues early, send the vehicle in for maintenance, and clear the fault before the inspection deadline hits. At that point, the job is no longer just about avoiding a failed test. It becomes a rule-based workflow: route the right vehicle to the right shop, then fix the issue based on risk and timing.
Static checklists don’t hold up well here. Configurable compliance rules work better because alert logic and maintenance triggers can change when EPA, CARB, or state programs change thresholds or intervals. For multi-state fleets, a smart move is to keep a regulatory map by vehicle class, fuel type, model year, and operating location. That makes it easier to track which units fall under CARB rules, which sit under federal standards, and which state I/M programs apply. When you connect live fault data to the right rule set, routine maintenance is easier to separate from inspection risk.
Key Regulatory Data Requirements at a Glance
Compliance Context Monitored Metrics Common Data Sources Operational Risks U.S. Federal (EPA) CO, HC, NOx, PM; OBD-II readiness status; emissions-related diagnostics EPA standards, VIN specs, OBD-II data Fines, registration denial CARB States Stricter NOx and PM thresholds; LEV/ULEV/SULEV tier compliance; ZEV sales tracking CARB certification data, VIN decoder, telematics Non-compliance, failed inspections, penalties State I/M Programs MIL status, DTCs, readiness monitors, EVAP system faults OBD-II scanners, state DMV/DEQ databases, repair records Failed inspections, reinspection fees, registration holds Heavy-Duty GHG (Phase 3) Fleet-average CO₂ targets, fuel consumption, powertrain diagnostics Telematics feeds, OBD/J1939 data, EPA reporting formats Non-compliance penalties, escalating targets through 2032 Low-emission zone access Vehicle age, fuel type, certification standard VIN decoder, telematics, license plate data Access restrictions, route limitations, entry fees
The same signals can also point to fuel waste and repeat repair patterns, which ties directly to the cost savings covered next.
Operational and Financial Benefits
The same live emissions data that helps with compliance can also point straight to fuel waste, repair issues, and lost uptime. In practice, those problems usually hit fuel spend and shop costs first.
Lower Fuel and Maintenance Costs
Harsh acceleration, idling, and poor routing all drive up fuel use. When you look at throttle position, RPM, fuel flow, and CO₂ readings together, it becomes much easier to see where that waste starts.
Fleets using telematics-driven idle alerts have achieved a 15.9% reduction in idling time and a 22.6% median reduction in harsh driving events, which led to average fuel savings of about 12%.[6] Motive reported that fleets using its data-tracking platform saved 3 million gallons of fuel in 2021, avoided 31,000 tons of CO₂, and saved about $2,530 per vehicle at an average fuel price of $3.29 per gallon.[1]
A big part of the savings comes from fixing problems before they turn into downtime. A diesel particulate filter that is starting to clog shows up in differential pressure readings and soot load estimates well before it causes a derate or a roadside breakdown. The same goes for an oxygen sensor that starts drifting out of range. It will often appear in diagnostic codes before it throws off fuel trim or damages the catalytic converter.
Fixing those issues during a planned service visit is far cheaper than dealing with an emergency repair, a tow, and lost operating hours. That’s why different teams need different views of the same data.
How Each Business Function Benefits
Real-time emissions data is not just for technicians. Any team tied to cost, uptime, risk, or reporting can use it in a practical way.
Business Function Cost Control Uptime Risk Reduction Reporting Compliance Teams Reduce repeat tests and fines Keep vehicles on route Lower regulatory penalties and legal exposure Produce audit-ready compliance reports Fleet Operations Lower fuel cost per mile Minimize breakdowns and derates Reduce service disruptions Track emissions and fuel efficiency by vehicle, driver, and route Service Departments Plan parts and labor from predictive data Coordinate repairs during scheduled downtime Prevent costly failures by addressing faults early Document repair history with fault codes and emission readings Finance Teams Track fuel spend and maintenance trends in USD Justify uptime investments with cost-benefit data Reduce exposure from fines and repair spikes Tie emission initiatives to cost savings and margin Sustainability Leaders Identify high-impact emission reduction opportunities Plan sustainability changes without disrupting operations Reduce ESG and reputational risk Prepare ESG reports with verified emission trends
The numbers to watch are pretty straightforward:
- Fuel cost per mile
- Unplanned downtime per vehicle per quarter
- Breakdowns per 100,000 miles
- First-pass inspection rate
- Emission-system repair frequency and cost
- Alert-to-repair time
These metrics tie emissions data directly to operating expense. They also give finance teams the inputs they need to calculate ROI across a 12- to 24-month window.
To put these gains to work across a fleet, teams need those signals moving into telematics, maintenance, and compliance systems in real time.
Data Infrastructure, APIs, and Integration
Real-time emission data cuts compliance risk and operating cost only when it moves cleanly from the vehicle into the systems that send alerts, book service, and generate audit reports. That setup matters because an alert by itself doesn't do much. It has to connect to the right vehicle, the right fault code, and the right rule set.
Building the Emissions Data Stack
Every U.S. vehicle from model year 1996 and later exposes engine and emissions data through an OBD-II port. Heavy-duty commercial vehicles usually rely on J1939/J1708-based telematics hardware instead. In both cases, the data moves over TLS-encrypted cellular or satellite links to a cloud ingestion endpoint.
From there, a streaming pipeline handles the load. Connected vehicles can generate between 25 and 67 billion diagnostic data points per day [7]. That's a huge stream of information, so the raw data has to be cleaned up before anyone can use it.
Here’s what happens in practice:
- Raw OBD data gets decoded into readable fields
- Units get standardized
- Telemetry gets joined to VIN data and vehicle specs
That step turns a signal like high NOx from a messy machine output into something a team can act on. After that, a rules engine watches for key thresholds such as DPF soot load, DEF levels, SCR efficiency, idle time, and NOx and CO₂ limits. Then a reporting layer pushes alerts and dashboards to the people who need them. Once the data is normalized, it can support compliance rules, service alerts, and audit reports.
Where CarsXE Fits in the Workflow
CarsXE sits in the vehicle data enrichment layer of this stack.
When a telemetry message arrives with a VIN or license plate, CarsXE's VIN Decoder, License Plate Decoder, and OBD Codes Decoder APIs fill in the missing context before the data reaches dashboards and alert systems. That means teams don't just see a code or emission reading. They see which vehicle it belongs to, what specs matter, and what the fault may mean.
For fleets with imported or cross-border vehicles, CarsXE's International VIN Decoder normalizes specs from over 50 countries, so mixed fleets stay in one format. That enrichment layer turns generic telemetry into vehicle-level action by linking a fault code or emission reading to the right vehicle class, fuel type, and regulatory standard.
Data Layers for Internal Teams: A Comparison
Each layer has a different job. Laying them out clearly at the start helps teams avoid building duplicate systems or pulling from the wrong source.
Data Layer Purpose Key Fields Primary Teams Raw Telematics & Emissions Real-time signal capture from OBD-II/J1939 devices Fuel trim, O₂ sensor voltage, NOx, CO₂, RPM, GPS, idle time, DTCs Data Engineering, Fleet Operations Vehicle Master Data Contextual enrichment via VIN/plate decoding VIN, make, model, trim, engine type, fuel type, model year, emission standard Compliance, Analytics, Product Diagnostics & History Fault interpretation and repair tracking OBD code descriptions, recall status, prior faults, repair records, inspections Service Teams, Maintenance Regulatory Rules & Thresholds Compliance validation against applicable standards EPA/CARB limits, state requirements, fleet-defined thresholds Compliance, Legal
With the stack organized this way, teams can move faster when rules shift or new vehicle groups enter the fleet. That becomes even more important when planning for the emission standards still ahead.
Using Real-Time Data to Plan for Future Emission Rules
When live data already feeds compliance and maintenance systems, the next move is pretty simple: use that same data to decide when to repair, reroute, or replace. Instead of waiting for rules to tighten or for a fault to show up, teams can see risk sooner and plan repairs, route changes, and replacements based on measured vehicle performance.
Scenario Planning for Fleet and Service Decisions
A good place to start is sorting vehicles into three groups based on emissions risk. That turns raw readings into clear action priorities.
- Compliant vehicles have stable readings and no recurring fault codes.
- Borderline vehicles show upward emissions trends or intermittent DTCs.
- High-risk vehicles have repeated emissions faults, poor fuel economy, or output that stays high for their class and duty cycle.
From there, compare repair, retrofit, reroute, or replace by looking at emissions per mile, fuel trends, DTC frequency, repair cost history, and remaining asset life. The goal is to weigh each path against the others instead of treating every emissions issue the same way.
A truck with a localized aftertreatment issue, but sound parts elsewhere, may be a strong retrofit candidate. A vehicle with aging hardware, repeated faults, and high emissions intensity across many routes points more clearly to replacement, especially if stricter rules are coming.
Route reassignment needs its own review. A delivery van might perform fine on highway miles but struggle in stop-and-go urban driving. In that case, the problem may not call for a mechanical fix. Moving that van away from low-emission zones can cut compliance exposure while the business builds out a replacement plan.
For replacement timing, rank vehicles by emissions risk, repair frequency, fuel inefficiency, and estimated remaining useful life. Then place them into tiers such as immediate, next budget cycle, or monitor and hold. That helps avoid emergency purchases and spreads capital spending over time.
Key Takeaways for Auto Businesses
Used this way, the data becomes more than a compliance feed. It becomes a tool for budgeting and replacement planning. When paired with VIN data, fault history, and regulatory thresholds, real-time emissions data turns telemetry into a planning system for compliance, cost control, and replacement timing.
FAQs
How does real-time emission data reduce inspection failures?
Real-time emission data can cut inspection failures by helping teams handle problems before a vehicle gets to the testing center.
When you have a steady view of trouble codes and sensor health, it's much easier to catch issues early, like a bad oxygen sensor or a check engine light. That gives businesses time to fix the problem ahead of the test, which lowers the risk of non-compliance and improves the odds of passing the emissions inspection on the first try.
What vehicle data sources are needed to track emissions live?
To track vehicle emissions live, businesses need connected data sources that support real-time diagnostics and performance monitoring. CarsXE does this by giving access to OBD code diagnostics, which helps teams spot active engine or emissions-system issues as they happen.
These APIs can also pull data from verified databases, including government records, to add accurate vehicle specs and historical context. That makes emissions management more precise and helps with regulatory compliance.
When should a fleet repair, retrofit, or replace a vehicle?
A fleet should make this call using real-time data on reliability, maintenance costs, and emissions compliance.
If a vehicle is no longer cost-effective to keep on the road, it should move up the list. The same goes for vehicles that fail emissions standards. A non-compliant vehicle may be illegal to operate, and its value can drop right away.
CarsXE can help managers check service history, recalls, and diagnostic codes to spot repeat problems and emissions-related red flags.
Related Blog Posts
- VIN Decoding for Emission Compliance Tracking
- Ultimate Guide to Emission Compliance APIs
- Global Emission Standards: Compliance Guide
- How OBD Data Powers Predictive Analytics