Fuel Economy Standards and Emissions: A History

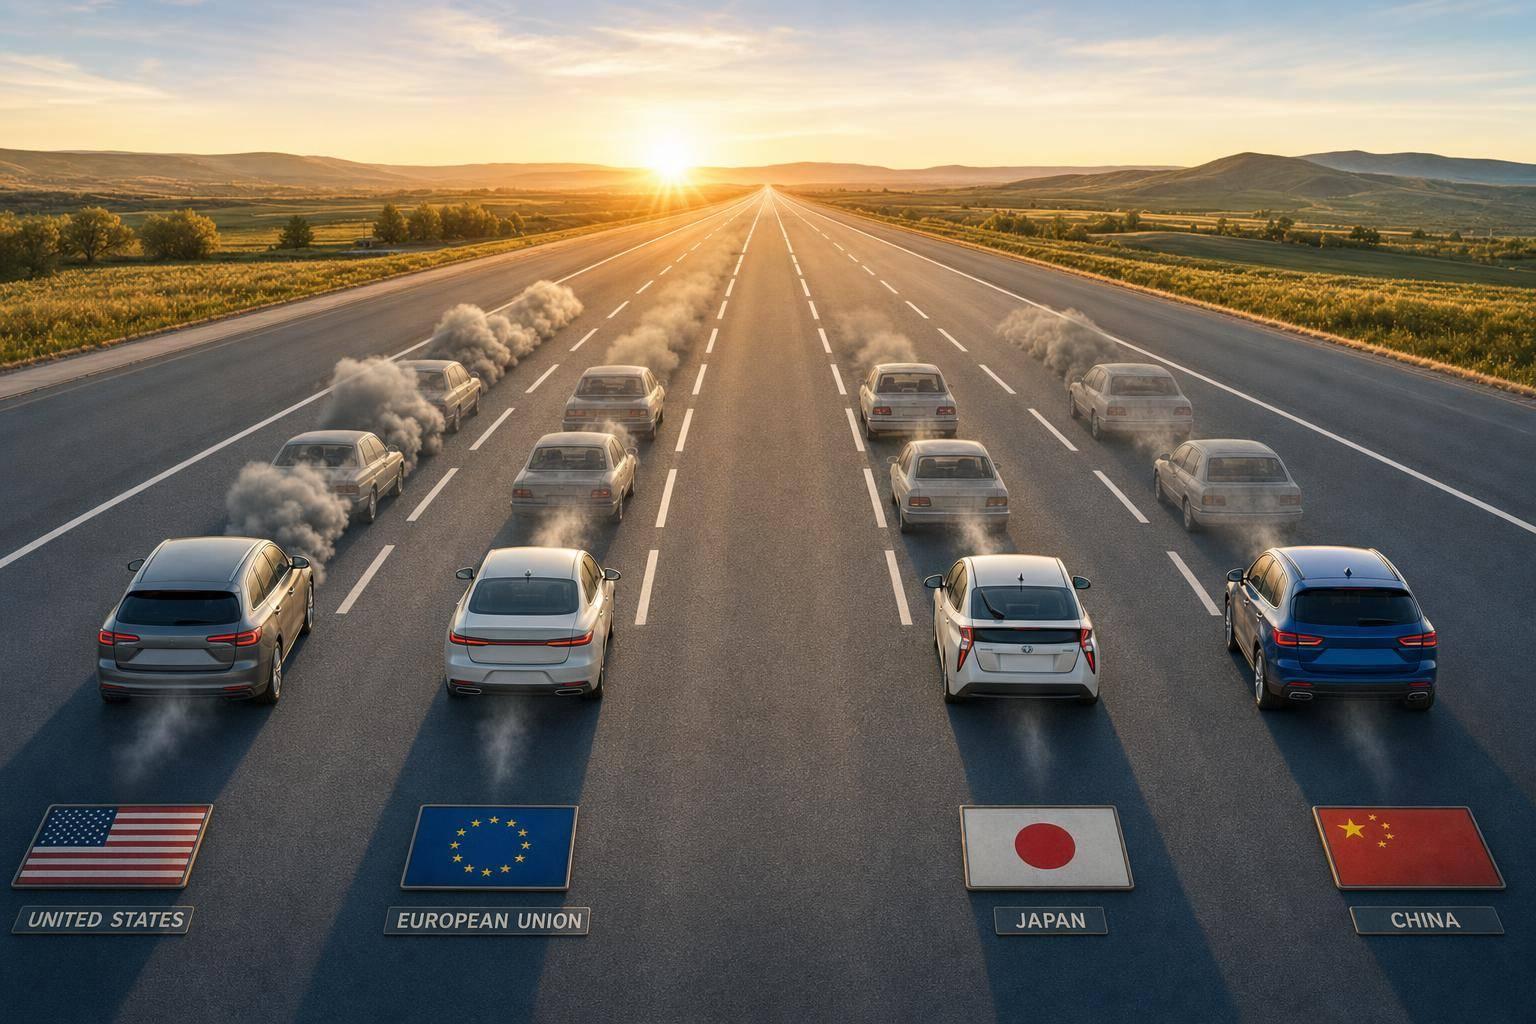
Fuel Economy Standards and Emissions: A History
Yes - stricter vehicle standards have usually meant lower fuel use and lower CO2 over time. That pattern shows up across the United States, EU, Japan, and China, even though each region used a different rule system.
Here’s the short version:
- I see a clear link between tighter rules and better fleet efficiency
- In the U.S., policy started with the 1970s oil shocks and CAFE rules
- In the EU, rules moved from pollutant limits to binding CO2 targets in g/km
- In Japan, the Top Runner system pushed automakers to match the best vehicles in the market
- In China, CAFC phases kept cutting average fuel use across new-car fleets
- When rules slowed, progress often slowed too
If you compare regions, the main thing to watch is the unit:
- U.S.: MPG and g/mi
- EU, Japan, China: L/100 km and g/km
That matters because higher MPG means less fuel use, while lower L/100 km means the same thing.
Global Fuel Economy Standards: A Region-by-Region Comparison
Fuel Economy Standards: How Did We Get here? Where Are We Going?
sbb-itb-9525efd
Quick Comparison
Region Main Metric Main Program or Rule Type What happened over time United States MPG, g/mi CAFE and GHG rules Fleet MPG went up and CO2 per mile went down EU g/km Euro rules plus fleet CO2 limits Average CO2 and some tailpipe pollutants fell Japan km/L Top Runner Fleet efficiency kept improving China L/100 km CAFC phases New-car fuel consumption fell across the fleet
My takeaway: the history is pretty simple. Rules got tighter, automakers improved vehicles, and average fuel use and emissions fell. The hard part is not seeing the trend. The hard part is comparing the data fairly across regions and test systems.
United States: From the 1970s Oil Crisis to Modern CAFE and GHG Rules
The U.S. standard-setting timeline starts with the 1970s oil shocks and the creation of CAFE.
U.S. standards started as fuel-economy rules, then grew into a broader set of fuel-use and emissions targets. The story begins with the 1970s oil crisis, when Congress created CAFE standards to cut fuel use. Later, those rules were paired with greenhouse-gas limits.
In U.S. reporting, emissions are usually measured in grams per mile (g/mi). Lower numbers mean lower fuel use. That system became the starting point for later tightening of both fuel-economy and emissions rules.
Europe and Asia: How the EU, Japan, and China Tightened Vehicle Efficiency Rules
Outside the U.S., regulators took a different route. In Europe, Japan, and China, fuel economy rules were tied more closely to emissions policy. That led to three different models: pollutant-based limits in Europe, benchmark-based efficiency rules in Japan, and phased fleet targets in China.
European Union: From Euro Pollutant Rules to CO2 Metrics
The EU started with Euro pollutant rules like Euro 4, 5, and 6. These standards targeted pollutants such as NOx, CO, HC, and PM. Later, the bloc added binding average CO2 limits measured in g/km.
That change mattered because it turned fuel efficiency into a direct compliance metric. CO2 figures also played a role in tax treatment and regulatory compliance [1].
Japan and China used different systems, but the goal was similar: lower fuel use and lower emissions.
Japan: Top Runner and Steady Efficiency Gains
Japan built its system around the Top Runner program. The idea was simple: use the best-performing vehicles already on the market as the benchmark, then require the rest of the fleet to catch up over time.
Instead of setting a fixed line and leaving it there, the program pushed automakers to match or beat the strongest current performers.
China: CAFC Phases and Lower New-Car Fuel Consumption
China took a phased approach through its Corporate Average Fuel Consumption program. Under CAFC, regulators kept tightening the average fuel consumption allowed across each automaker’s new-vehicle lineup.
In plain English, carmakers had to keep bringing down fuel use across the vehicles they sold, not just in a few standout models.
Cross-Region Trends: What the Historical Record Consistently Shows
Across the U.S., EU, Japan, and China, the record points in the same direction: tighter standards cut fuel use and emissions, while slower rulemaking pushed progress back. That didn’t happen by chance. It followed shifts in policy goals and the way regulators judged results.
Common Drivers Behind Tighter Standards
The main policy focus moved from oil security to cutting emissions. That shift changed the whole conversation. Instead of centering only on fuel supply risk, regulators put more weight on CO2 limits and day-to-day fleet performance.
CO2 in g/km became the main benchmark because it linked vehicle efficiency directly to both compliance and taxation. Once that happened, success was measured differently, and automakers changed course in response.
What Changed When Standards Tightened or Stalled
When standards got tougher, automakers moved fast on engines, transmissions, and power management to hit tighter targets. You can see the pattern clearly: stronger rules pushed more vehicle-side gains into the market.
When rulemaking slowed or stalled, fleet improvement slowed too. The historical record across regions shows that policy speed mattered, not just policy intent.
Cross-Region Summary Table
Region Core Metric Landmark Standard or Program Reported Outcome United States Fleet-average fuel economy Fuel economy standards Higher fleet-average MPG and lower g/mi CO2 European Union g CO2/km Euro 4, Euro 5, Euro 6 [1] Lower fleet-average CO2 and particulate emissions Japan km/L Top Runner Program Steady fleet-average efficiency gains China L/100km CAFC phases Lower new-car fuel consumption across the fleet
These region-by-region patterns set up the article’s final takeaway on fuel savings and emissions cuts.
Conclusion: The Historical Link Between Standards, Fuel Savings, and Emissions Cuts
Across the U.S., EU, Japan, and China, tighter standards kept leading to the same result: lower fuel use and lower emissions. Different markets took different paths, but the pattern stayed pretty clear. For analysts, the main job is tying those rules back to vehicle-level data.
Key Takeaways for Analysts, Developers, and Automotive Businesses
The record points to three takeaways.
First, standards vary by region, but the direction is the same: tighter rules tend to line up with lower fleet emissions.
Second, cross-market comparisons need careful unit conversion and metric matching. If you skip that step, it's easy to compare apples to oranges.
Third, the regional systems were not identical, but the end result was similar. Stronger standards usually meant cleaner, more fuel-efficient fleets.
This is where structured vehicle data starts to matter in a very practical way. Platforms like CarsXE help connect the dots. Its International VIN Decoder API can return structured attributes such as emission_standard, avg_co2_emission_g_km, fuel_type, and plant_country, helping users map a vehicle's specs to the regulatory framework it was built under [1][2].
The remaining task is mapping today's fleet to the standards that shaped it.
FAQs
Why do regions use different fuel economy units?
Regions use different fuel economy units because they follow local rules and measurement systems. In the United States, MPG is the standard. In many other places, L/100 km is more common.
That split comes from broader regional standards too. The European Union and the U.S., for example, use different ways to measure and report things like emissions and vehicle efficiency, so the fuel economy unit usually follows that same system.
How are fuel economy and CO2 emissions connected?
Fuel economy and CO2 emissions go hand in hand. When a vehicle uses less fuel, it usually produces less CO2. The reason is simple: an engine that burns less fuel to cover the same distance puts less carbon dioxide into the air.
CO2 emissions are tied to the amount of fuel a vehicle uses. They're measured with standardized test cycles and usually shown in grams per kilometer (g/km). If an engine isn't running well, fuel use can go up, and emissions can climb with it.
What happened when standards stopped tightening?
When emissions and fuel economy rules stop getting tighter, progress usually stalls too. Reductions in pollutants like nitrogen oxides, carbon monoxide, and particulate matter often level off. The same pattern shows up in fuel efficiency, which means cuts in greenhouse gas emissions slow down as well.
Real-time data helps make those shifts easier to spot. It can show when fuel types start changing and when different regions hit key turning points.
Related Blog Posts
- Global Emission Standards: Compliance Guide
- Cultural Trends in Cross-Border EV Adoption
- Global Emission Standards: What Developers Should Know
- Vehicle Import Rules: Emissions Compliance by Region