Global Luxury Car Revenue: 2026 Market Overview

Global Luxury Car Revenue: 2026 Market Overview
Here’s the short answer: there is no single 2026 global luxury car revenue figure. I’d read the market as a forecast range in U.S. dollars, not one hard number, because reports use different pricing rules, segment definitions, and regional inputs.
If you want the main takeaways fast, they are these:
- 2025 is usually the base year, and 2026 is the first forecast year in most reports.
- Luxury SUVs and crossovers still bring in the biggest share of revenue.
- ICE models lead total revenue, but BEVs and PHEVs are taking a bigger share.
- North America, Europe, and Asia Pacific drive most of the market.
- Mercedes-Benz, BMW, and Lexus stay near the top by revenue, while BYD is growing in premium EVs.
- Revenue estimates shift because some sources use MSRP, while others use retail market value, wholesale value, or auction value.
In plain terms: if you compare two 2026 reports and they don’t match, that does not mean one is wrong. It usually means they measure the market in different ways. Model mix, option packages, local pricing, and region-level data can all change the final dollar figure.
What matters most in 2026? High-priced SUVs, electrified models, and regional pricing differences. Those three factors shape much of the market view.
The rest of the article builds on that core idea and sorts the market by brand, segment, powertrain, and region.
Global Luxury Car Revenue in 2026
2025 to 2026 Revenue Range and Growth Rate
Using the method above, the 2026 revenue range shows a simple point: published forecasts don’t line up perfectly because each report values the market a bit differently. So the 2026 luxury-car revenue figure is best shown as a range, not a single number. These published 2026 figures are forecast ranges, not measured totals.
Why the gap? It usually comes down to three things. Some sources price vehicles based on MSRP, while others use market-adjusted value, wholesale pricing, or auction pricing [2]. On top of that, optioned pricing can push per-unit revenue above base MSRP [2]. The same pattern shows up at the regional level. North America is usually the steadiest data set, while other regions tend to swing more. You can see that most clearly in the regional split below.
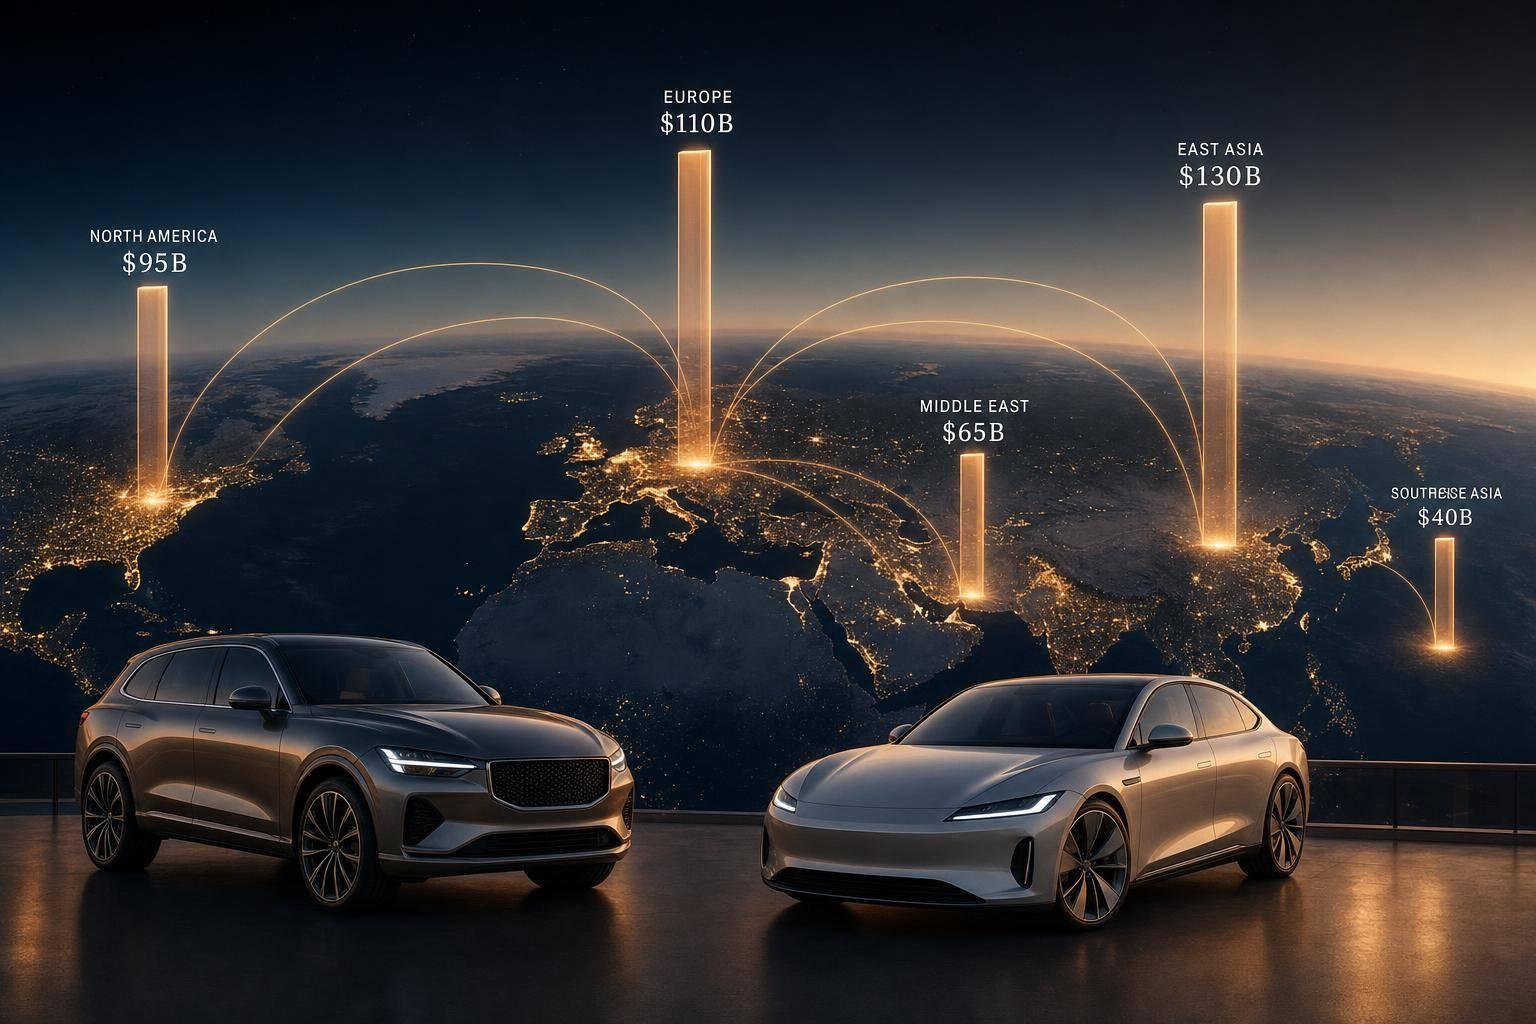
Regional Revenue Breakdown
Regional totals shift for the same basic reasons as global totals. Sources with strong market coverage in North America - especially the United States, Canada, and Mexico - usually show more consistent estimates for that region. In other parts of the world, figures can move around more when local market data isn’t as fully integrated [3].
sbb-itb-9525efd
Leading Brands and Revenue Concentration
2026 Global Luxury Car Market: Brands, Segments & Powertrains Compared
Brand-Level Revenue Signals for 2026
At the brand level, 2026 luxury-car revenue is still clustered around a small group of global automakers. Mercedes-Benz, BMW, and Lexus continue to lead the premium segment, each holding a high share of revenue thanks to broad model lineups, pricing power in key regions, and steady demand in their main markets [1].
BYD is also pushing further into the premium space in China and across emerging markets. That growth is tied to rising NEV adoption and a larger range of higher-priced models [4].
Market Share, Geography, and Model Mix
Germany, the United States, China, and Japan remain the main demand hubs, but each market leans toward a different brand mix and product setup [1]. China is seeing fast growth in premium NEVs. In the U.S. and Europe, revenue stays strong through high-value trims and strong per-unit pricing across well-known luxury nameplates [1].
The table below shows which luxury brands look most concentrated by revenue in 2026.
Brand 2026 Revenue Concentration Primary Regional Markets Key Segment Focus Mercedes-Benz High Europe, U.S. Premium sedans, SUVs [1] BMW High Europe, U.S., China SUVs, performance sedans [1] Lexus High U.S., Japan SUVs, hybrid models [1] BYD Growth China, emerging markets Premium NEVs [4]
The next section breaks this revenue mix down by segment, powertrain, and region.
Revenue Mix by Segment, Powertrain, and Region
SUVs, Sedans, Sports Cars, and Price Bands
At the segment level, revenue is still concentrated in high-priced utility models. Large luxury SUVs and crossovers remain the main revenue driver in 2026, helped by high average selling prices and strong demand in key markets [2].
But sticker price doesn't tell the whole story. In this segment, valuation depends on mileage, condition, and local demand, not base MSRP alone [2]. That matters because two versions of the same model can land at very different market values once equipment, wear, and regional demand come into play.
Sedans still deliver steady volume in the core luxury segment. Sports cars and ultra-luxury models, meanwhile, stay clustered at the top end of the market. Across all of these segments, pricing is shaped by the gap between base MSRP, retail equipped pricing, and final adjusted market value [2].
ICE, PHEV, and BEV Revenue Split
ICE models still generate the largest share of luxury car revenue in 2026, but BEVs and PHEVs are gaining share as electrification picks up [6]. In plain English: the revenue mix is no longer just about vehicle type. It's now shifting by powertrain too.
Regional Market Drivers and Cross-Border Effects
Regionally, the same models can produce different revenue signals because valuation rules vary from one market to another. Luxury valuation data is deepest in North America, which makes regional comparisons more stable there [3][5].
In the U.S., high-trim SUVs and option-heavy builds can sell for more than base MSRP [2]. That's where cross-market comparisons get messy. If one region leans toward heavily equipped models and another doesn't, like-for-like pricing comparisons become much harder [2].
Conclusion: Key 2026 Revenue Findings
Main Points to Retain
Put simply, the 2026 reports don’t point to one fixed global luxury-car revenue number. They point to a range, and that range shifts based on vehicle specs, market values, segment labels, and regional adjustments.
Most of the 2026 movement comes from large luxury SUVs and crossovers, along with PHEV and BEV models. North America, Europe, and Asia Pacific shape most of that revenue mix. In practice, revenue depends more on product mix and regional valuation than on any single global total.
CarsXE can help validate this with VIN decoding, market value data, and segment classification across 50+ countries [2][7].
FAQs
Why is there no single 2026 revenue number?
There’s no single 2026 luxury car revenue figure because “luxury” and “revenue” don’t mean the same thing in every report.
The main issue is definition. One source may count premium sedans and SUVs only, while another may include ultra-premium brands, performance models, or even high-end EVs. That changes the total right away.
The same thing happens with revenue. Some reports measure market value as consumption value in US$ millions. Others build estimates from sales volume and average selling price. Those are not the same methods, so the totals won’t match.
Forecast timing adds another layer. Analysts often use different base years, cover different regions, and project across different time windows. So even when two reports are both talking about 2026, they may be starting from different assumptions and using different market scopes.
Which luxury vehicle types drive the most revenue?
Large crossovers and SUVs are major revenue drivers in the luxury automotive market. People want the space, the higher seating position, and the long list of upscale features. On top of that, premium pricing is often backed by advanced drivetrains and loaded interiors.
If you want a closer look at how this segment is performing, CarsXE market data can help track valuation trends, MSRP, and retail pricing.
How do regional pricing differences affect forecasts?
Regional pricing differences change the baseline value in each market. CarsXE’s Market Value data breaks this into base price, mileage adjustments, and a regional adjustment. It then calculates an adjusted market value that reflects local demand and pricing.
For regional luxury car revenue forecasts, use region-specific retail and trade-in adjustments instead of one global price baseline. At the same time, keep condition, mileage, and feature effects tied to each region’s adjusted values.
Related Blog Posts
- How Brand Reputation Impacts Car Depreciation
- EV vs. Hybrid: Regional Adoption Trends
- Global Luxury Car Sales Trends by Trade Zones
- Regional Economies Shaping Car Brand Popularity